For this experiment, a movie of a ping pong ball falling in front of a grid with 1" grid marks is collected using a camera from a iPhone 5S at the 120 frames per second rate. The Camera was set up about 5' away from the screen to capture a field of view that spanned about 5'. In Understanding Physics, Asimov suggests that a ping pong ball may be too light, and thus be impacted adversely by air resistance. So the expectation was that the ping pong ball would fall slower than the predicted rate.
The prediction would be that the ball falls such that the following equation holds true:
X = X0 - gt^2/2, where g is the acceleration due to gravity, X0 is the initial position of the ball, and t is the time elapsed since the initial position. The acceleration due to gravity is 32.174 feet per second per second ( see http://en.wikipedia.org/wiki/Standard_gravity , for example).
In order to avoid any issue with the release of the ball (I held it in my fingers and just dropped it), I looked through the video and started data analysis after the ball had bounced on the ground once, and then just started to fall again after the first bounce. I used Quicktime Player to step through individual frames. To do this, freeze the movie, and then use the arrow keys to step by frame. Call X0 the position at the top of flight after the first bounce, and record this as position zero. Then step forward a frame, and record the position (as compared to the background scale). I tabulated this data in a spreadsheet.
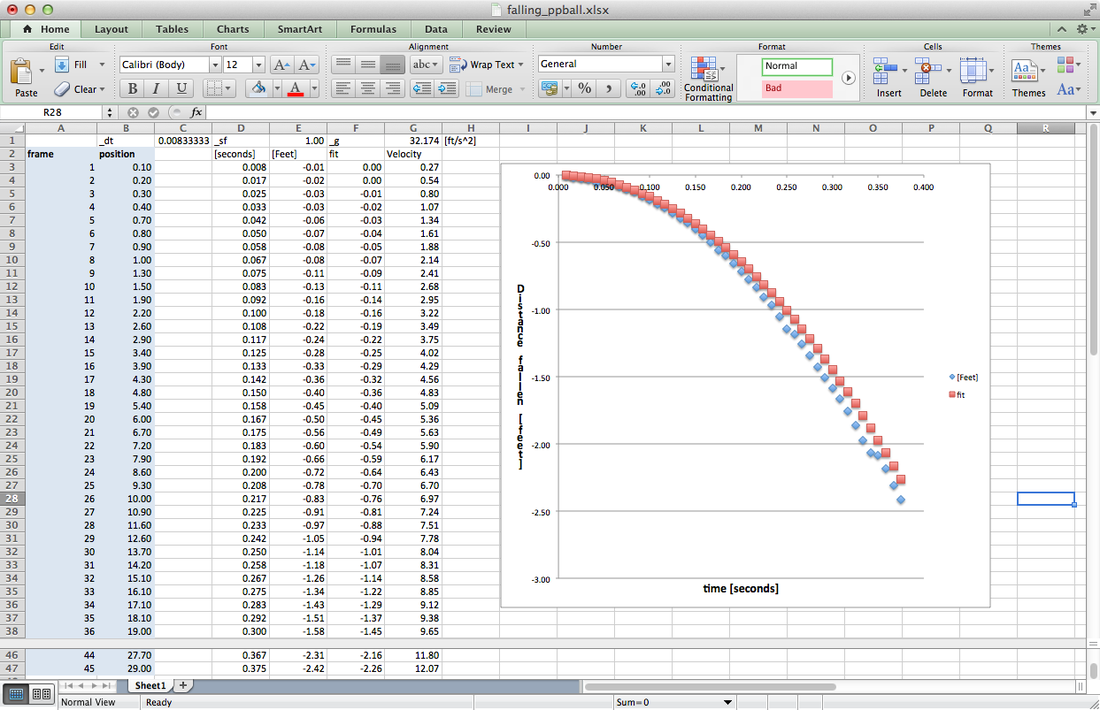
The first column in the spreadsheet is the frame number. The second column is the ball position (I counted the number of grid squares the ball had moved from the initial position). Column D converts frame to units of elapsed time by assuming each frame is 1/120 seconds. This is listed as dt = 0.008333 seconds, which is used as a variable in the spreadsheet. Column E converts the position from inches to feet. The value is negative to show that the ball is falling. Column F is calculates what the value "should be" if using the equation X = X0 - gt^2. The results are plotted on the right. The blue diamonds are the measured data, and the red diamonds are from the equation. Notice that the horizontal axis is in units of seconds and the vertical access is in units of feet. It takes less then a half second for the ball to fall 2.5 feet.
The blue data points follow the curve pretty well, but there are some jagged effects, likely due to error in the estimation of the ball position. But the striking thing is that the ball falls faster than theory, not slower. Why is this? Let's find out!
Here are some hypotheses:
1) Gravity is really stronger than 32.174 feet per second per second.
- If you change the value for gravity to 35 feet per second, you get an excellent match between red and blue
- At 1000 feet above sea level, gravity should get slightly weaker, not stronger, eliminate this hypothesis?
2) The grid scale is not really 1" per square
- A quick check with a ruler shows that the grid lines are truly 1" squares
- but if you change the scale factor to 0.9" per square then you get an excellent fit
3) The time per each frame is not really 1/120 seconds
- The iPhone 5S camera specification clearly gives a value of 120 frames per second
- but if you change the time scale to 1/115 seconds per frame, then you get an excellent fit.
So which is it? How do we decide?
 RSS Feed
